Google Epidemiology FTW

April 29, 2009

I’m a big fan of Google’s way of doing things. For example, the idea of spending one day a week on personal projects is a brilliant way to tap into the hidden skills and ideas of your staff. I’m also a big fan of data. Well, not data in it’s rawest sense, but the uses to which it can be put. So, really I’m a big fan of analytics. Google is one of the biggest repositories of behavioral data there is – simply because we spend so much of our time online and using Google to search.

Google Flu Trends

Google Flu Trends

Google Flu Trends

One very beneficial graduate of Google’s labs is the Flu Trends product. This measures the prevalance of searches for flu related terms in the US and can estimate flu activity up to two weeks faster than traditional methods. And last week the Centres for Desease Control in the US asked Google to perform a similar analysis of data from Mexico to see if the spread of swine flu was reflected in the data before the media got hold of the story. And it was.

Google Flu Trends Mexico

Google Flu Trends Mexico

As you can see from the above graph, there is an unseasonal rise in flu related searches from early April.

The power of this type of analysis is only just being realised, but the sheer amount of data and its range means that it is going to take some impressive analytical minds to design useful products. As this Wired article says, nobody was looking at the Mexico data when it would have been useful.


650mph Car Pancake

April 13, 2009

I don’t normally like simply pointing you to another blog entry with no narrative or analysis, but there isn’t really much else to say about this one. Definately one for the boys. The video’s about 4 1/2 minutes long but its worth hanging on for the slow-mo.

Mythbusters – what a job!


Reaching 50 million people

April 11, 2009

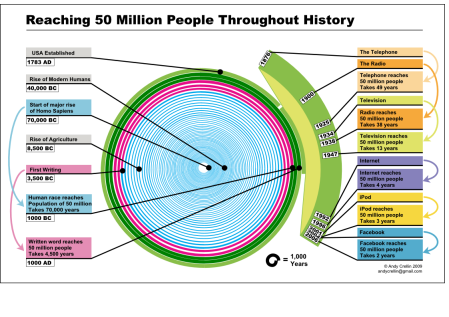
How do you show a span of 70,000 years on the same diagram as a span of 3 years? This is actually much more difficult that it might at first seem – especially if you have multiple items with very short spans that you want to show at the same time as a few items with very long spans.

I got thinking about this after reading a couple of factoids about the length of time it took for things like the iPod and Facebook to take off. I started thinking about the length of time it took for other technologies to reach 50,000,000 people,  as this was the number used for the iPod and Facebook comparison. The image below is an attempt to show this information on a single diagram. I have included the rise of the human race, writing, radio, television, the Internet, the iPod and Facebook. I’d like to include more technologies to fill in the gaps in the thousands-of-years range, so I might update this diagram in the future.

Reaching 50 Million People

Reaching 50 Million People

What was also interesting was the rate a which the reach of technology changed over time. By plotting the log of the age of the technology against the log of the length of time it took to reach 50 million people, I got the following chart.

Access to Technology

Access to Technology

Although this isn’t really a formal scientific treatment, it looks like that for technologies that are accepted (i.e. continue to be popular after the initial hype), reaching 50 million people should now take less than a year – and this is only going to get quicker and quicker!

If you want to use either of these diagrams I am happy for you to do so, but please make sure you reference the source.


Million Year Art

April 4, 2009

Sometimes, we puny humans are completely redundant when it comes to creating great art. Just let nature get on with it and jaw dropping, adjective exhausting, sense overloading pieces of art pop up all around us. Well, after a million years or so.

This site (http://www.earth.uk.net)  is a collection of photographs of cross-sections of agates and other rocks and minerals, highlighting the spectacular formations often rendered on tiny scales. I can heartily recommend browsing though the images – they are also available to buy in large format and mounted.

My top 5 (find them on the site as they look much better on a black background), which I would be happy to hang in my house, are:

1
1
2
2
3
3
4
4
5
5